Short answer: A DTC brand stops chasing tactics when every campaign, channel and test answers to one page: your unit economics, the MER (marketing efficiency ratio) target those economics allow, and a channel mix sized to hit a revenue goal at that MER. Start with contribution margin per order, turn it into a break-even MER and a target MER, divide your revenue goal by the target MER to get a total ad budget, then split that budget across channels to scale, support and test. Review it weekly against one scoreboard.
Most stalled DTC brands are not short on ideas. They are short on a filter. Every week brings a new hook format, a new Advantage+ setting, a new channel someone says is "the next Meta," or a new landing-page trick. Each one gets tested in isolation, judged on whatever metric the platform reports, and then dropped when the next idea arrives.
The result looks busy but doesn't compound. Budgets swing around, nobody knows whether last month was profitable until the accountant says so, and creative teams make ads with no clear brief. The cause is almost always the same: there is no written agreement on what a customer is worth, how much you can pay to acquire one, and which channels are expected to deliver them.
A strategy is that agreement. It doesn't need to be a 40-slide deck. For most brands doing roughly $1M–$20M a year, one page is enough, as long as the numbers on it are real.
The one-page plan has seven blocks, and they are written in order because each one depends on the one before it.
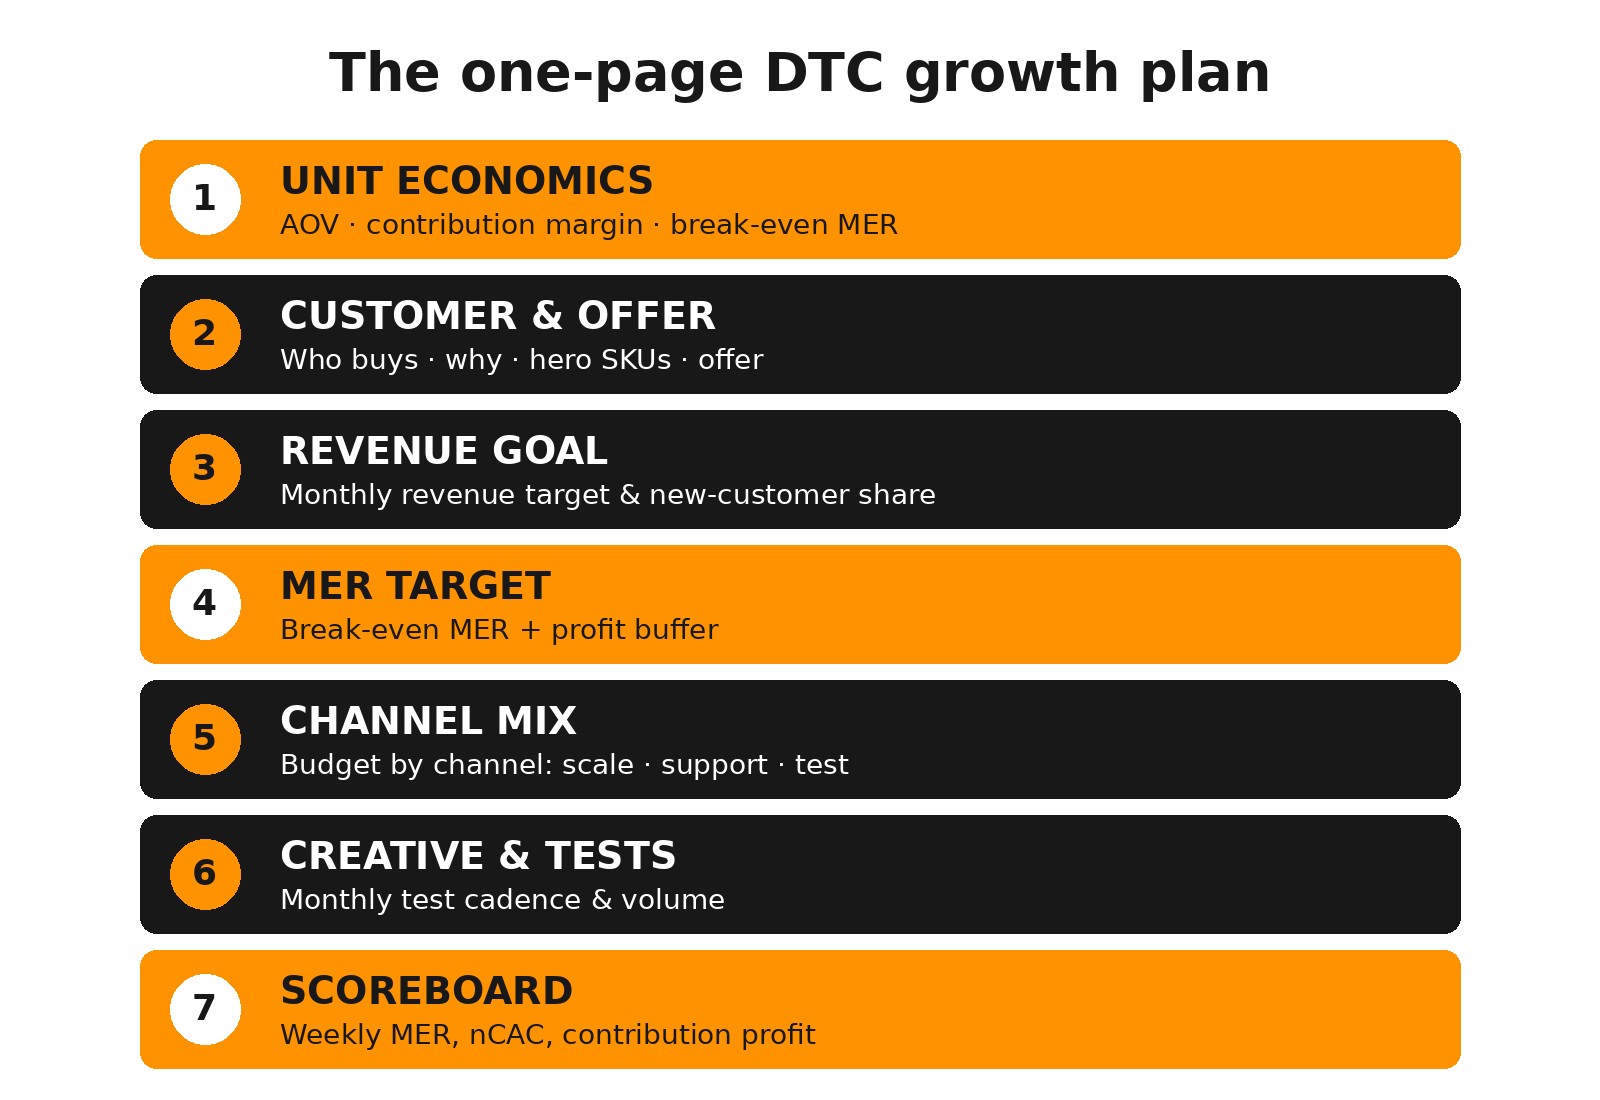
If you can't fill in a block, that is the first piece of work. A plan with a blank unit-economics block is just a wish list.
Unit economics answer one question: how much money is left from an average order before you spend anything on marketing? That number is your contribution margin before ad spend.
Start from AOV and subtract every variable cost that comes with an order:
Divide what's left by AOV and you have contribution margin as a percentage. Do this by hero SKU as well as for the store overall, because a brand often advertises its lowest-margin product without realizing it.
Two more numbers belong in this block. The first is new-customer CAC (ad spend divided by first-time customers). The second is a realistic view of repeat purchase, such as the share of customers who reorder within 90 days. If repeat rate is strong, you can accept a thinner first-order margin; if it is weak, the first order has to pay for itself. Our guide to customer acquisition cost goes deeper on CAC.
MER is total revenue divided by total ad spend across every channel. Because it is blended, it can't be gamed by one platform claiming credit for the same sale another platform also claimed. That is why it's the anchor of the plan. If MER is new to you, start with our MER vs ROAS guide.
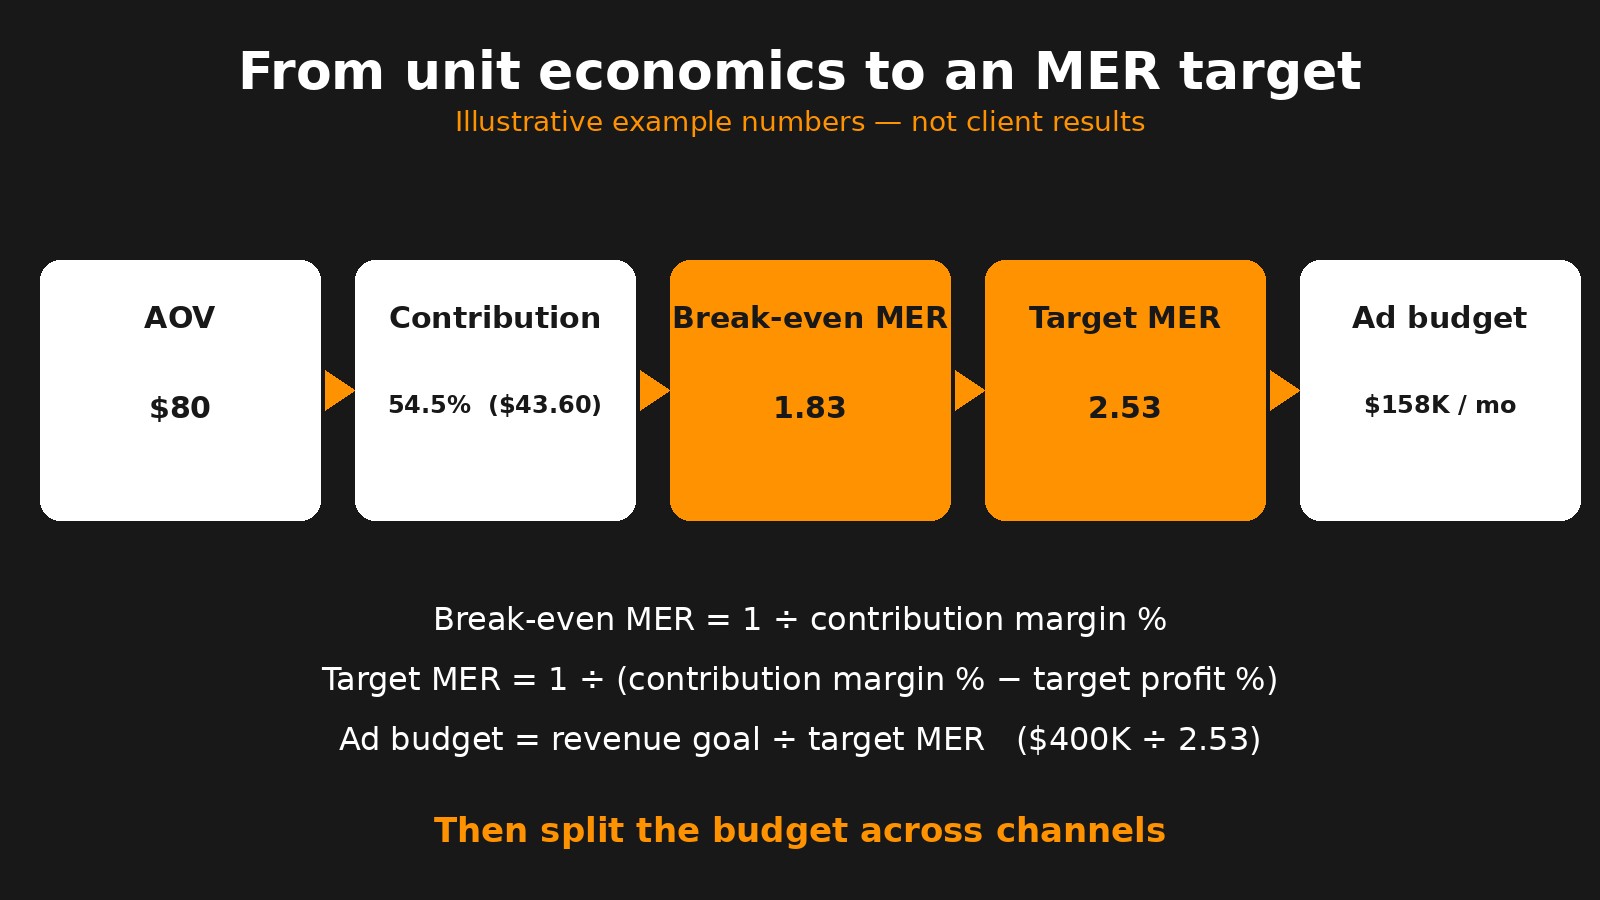
Three formulas do the work:
Set a floor too. Most brands use break-even MER plus a small cushion as the line where budgets get cut, and the target MER as the line where budgets can be raised. During peak periods like BFCM you may deliberately run closer to the floor to win new customers; our BFCM budget and MER guide covers that trade-off.
Once you know the total budget, split it by the job each channel does instead of by habit. A simple structure:
Keep the test budget fixed. It lets you try new things without the whole plan drifting every time a new platform gets hyped. When a test beats your target MER for a few weeks with stable volume, move it into the support or scale bucket in the next monthly plan.
Inventory belongs in this conversation too. There's no point scaling a channel around a hero SKU you can't restock in time; see our guide to inventory planning for DTC brands scaling ads. And don't ignore organic: a solid ecommerce SEO program lowers blended acquisition cost over time, which lifts MER without extra spend.
The numbers below are illustrative examples to show the math. They are not results from a Lion Media client.
Imagine a skincare brand with an $80 AOV.
From there:
The channel mix for that budget might look like this:
The scoreboard then tracks weekly MER against the 2.53 target and the roughly 2.0 floor (break-even plus a cushion), new-customer CAC, and contribution profit in dollars. If MER holds above target for two or three weeks with stable CAC, the brand raises budget in steps of about 15–20%. If it drops toward the floor, it cuts back and looks at creative and the offer before blaming the algorithm.
Notice what the example does: it tells you whether a new tactic is worth trying. A new ad format that lowers CPMs but brings in buyers at a 1.6 MER is a step backward, even if it looks good in the platform dashboard.
Tactics don't go away. They just get a job. Every tactic should be tied to one block on the page and one number on the scoreboard:
Before a tactic gets budget, write one line: "This should move X from A to B within N weeks." If you can't write that line, the tactic waits.
Use three rhythms:
Keep the page in a shared doc everyone on the team and your agencies can see. When a new idea comes up in a meeting, the first question is which block it affects.
Every engagement at Lion Media starts with this page. Before we touch campaign structure or creative, we build the unit economics, set the break-even and target MER with the founder, and agree on the channel mix and scoreboard. Across clients, Lion Media has managed $50M+ in ad spend at a 4.9x average ROAS, with a 5.0★ client rating. Learn more about our performance marketing agency.
We'll work through your unit economics, set a break-even and target MER, and show you a channel mix that fits your goal. Book a free growth audit with Lion Media.
Strategy decides what a customer is worth, what you can pay to acquire one and which channels should deliver them. Tactics are the specific actions, like a new ad format or landing page, used to hit the numbers the strategy sets.
Divide 1 by your contribution margin percentage before ad spend. For example, a 54.5% contribution margin gives a break-even MER of about 1.83.
There is no universal number. A good MER is one above your own target MER, which comes from your contribution margin and the profit you want to keep. Brands with thin margins need a higher MER than brands with rich margins.
Many brands keep a fixed test budget of around 10% of total spend. That is enough to learn from new channels and offers without putting the core plan at risk.
Use MER to set the total budget and judge the business, and use platform ROAS to compare campaigns and ads inside a channel. Platform ROAS tends to over-credit, so it shouldn't drive total spend on its own.
Review the scoreboard weekly, update unit economics and budgets monthly, and revisit customer, offer and channel roles each quarter.
Book a free 30-minute growth audit. We'll review your ads, tracking and site, and show you where the profit is leaking.
No commitment. No pitch deck. A real conversation about your growth architecture.