Why Your ROAS Is Lying To You (And What Metric Actually Matters)
Introduction
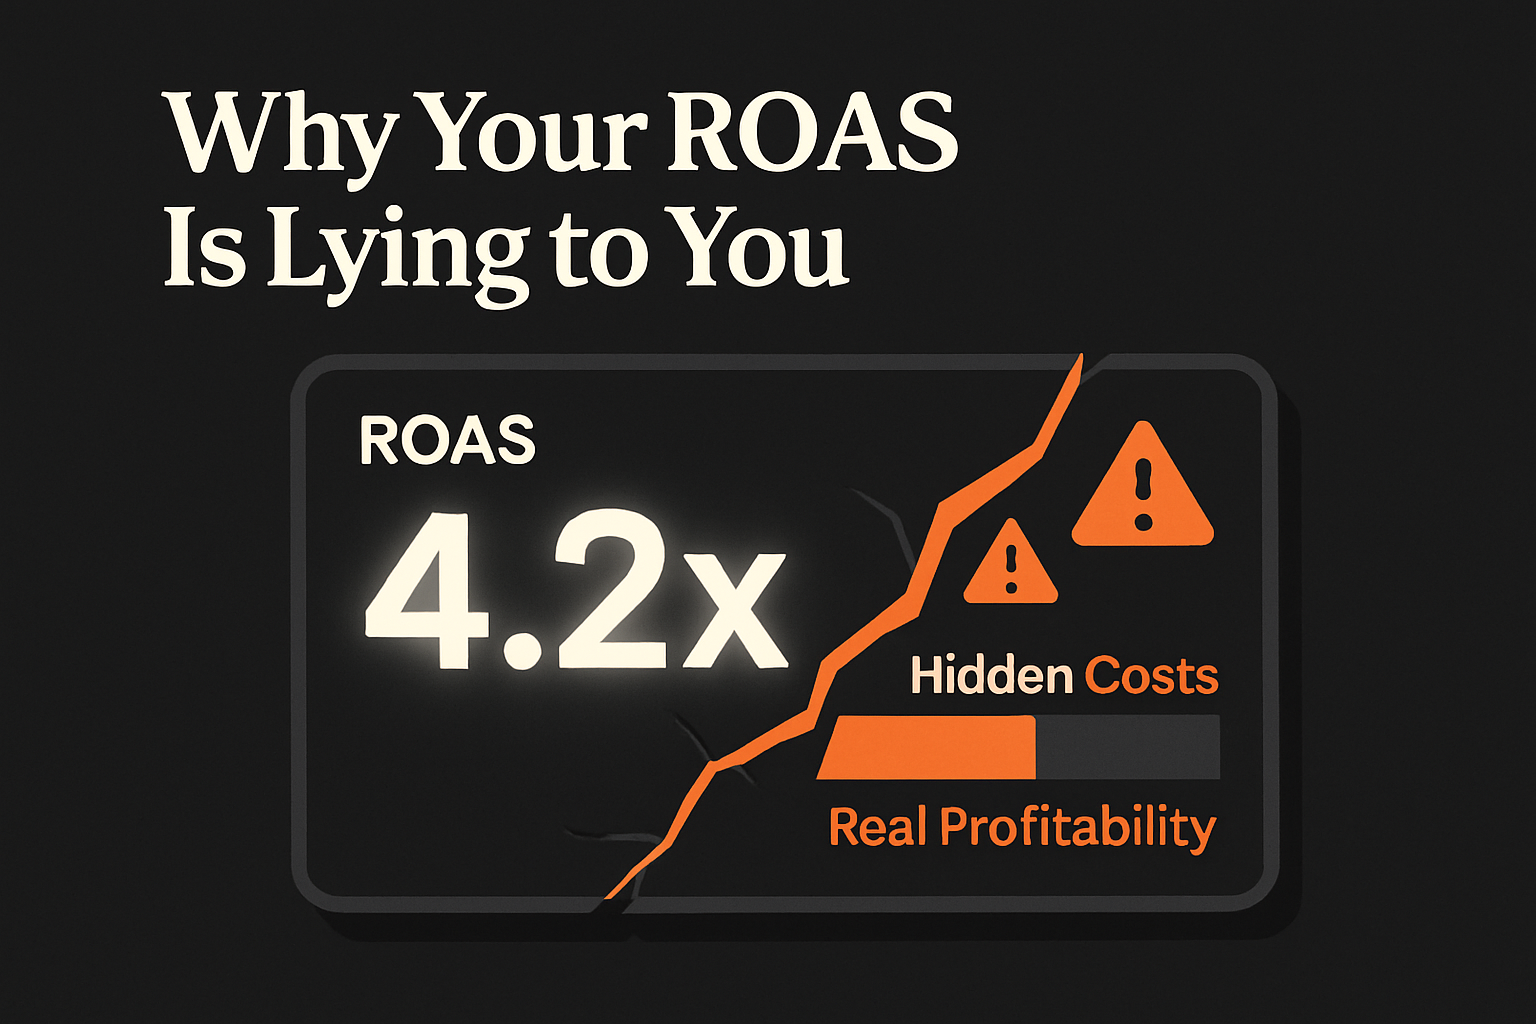
Your Meta dashboard says you have a 4.5 ROAS. Your bank account says you are losing money. The dashboard is lying.
Not because Meta is dishonest. Because ROAS was never designed to tell you whether your business is profitable. It was designed to tell you whether a specific ad drove a specific click that led to a specific purchase within a specific time window. That is a completely different question.
Billions of dollars have been wasted by DTC brands optimizing for a metric that measures the wrong thing.
Here is exactly how it happens.
The Three Ways Platform ROAS Is Inflated
Attribution overlap. When someone sees your Meta ad on Monday, clicks your Google ad on Wednesday, and buys on Thursday, both platforms will claim that sale. Meta says 4.5 ROAS. Google says 3.2 ROAS. You add them up and get a combined ROAS that is mathematically impossible relative to your actual revenue. This is not a bug. It is how last-click and view-through attribution work. They are designed to claim credit, not allocate it fairly.
View-through conversions. By default, Meta counts a conversion as an ad-attributed sale if the customer saw your ad in the past 24 hours before buying, even if they never clicked it. Someone who saw your ad while scrolling, forgot about it, and then Googled your brand to buy counts as a Meta conversion. If you are running brand awareness alongside performance campaigns, your ROAS is likely inflated by a significant margin because of view-through attribution.
Inconsistent conversion windows. The industry has no standard conversion window. Some accounts report on a 7-day click, 1-day view window. Others use 28-day click. A 28-day click window in a high-intent category will show dramatically higher ROAS than a 7-day window for the same underlying business results. When you compare ROAS numbers across campaigns, or against an industry benchmark, you are often comparing completely different measurement windows without knowing it.
The result is a number that looks like a meaningful signal but is actually a composite of overlapping claims, generous attribution rules, and inconsistent windows. It tells you what the platform wants you to believe about its own performance.
ROAS-Chasing Leads to Bad Decisions
Optimizing for platform ROAS does not just give you a misleading number. It actively pushes you toward decisions that hurt profitability.
You cut campaigns that look unprofitable on ROAS but are actually driving customers through channels that get the eventual credit. You over-invest in retargeting because retargeting always shows high ROAS — it is serving ads to people who were already going to buy. You scale campaigns on a high-ROAS signal, only to find that overall revenue does not move because the ROAS was inflated by attribution overlap.
The deeper problem: when your media buyers optimize to hit a ROAS target, they are optimizing the platform's story about itself. Not your actual margin.
We have audited accounts spending $100K+ per month where the team believed they had a profitable operation based on dashboard ROAS, and their actual MER — total ad spend divided into total revenue — was below 1.0. They were spending more than they were making. The platform said otherwise.
The Metric That Tells the Truth: MER
The roas vs mer debate comes down to one question: which number can the platform game and which can't it touch? Marketing Efficiency Ratio is simple: total revenue divided by total ad spend across all channels.
It is calculated from your Shopify or payment processor, not from ad platform dashboards. Platforms cannot inflate it because they do not touch the inputs. If you spent $50,000 across Meta, Google, and TikTok last month and generated $175,000 in revenue, your MER is 3.5. That number reflects reality.
MER does not replace ROAS entirely. You still need in-platform signals to make tactical decisions about which ads to scale. But MER is the executive layer that tells you whether the aggregate operation is profitable. ROAS is the tactical layer that tells you which ads to adjust.
For the full breakdown of how to calculate MER, what a healthy MER looks like for your category, and how to build a measurement system that uses both metrics correctly, read the MER vs ROAS deep dive.
Stop Optimizing for the Number the Platform Controls
The shift is not complicated. Pull your total revenue from Shopify. Pull your total ad spend from all platforms combined. Divide. That number is your MER. Compare it week-over-week and month-over-month. Use it as your north star for scaling decisions.
When you make decisions from MER instead of platform ROAS, you stop optimizing for the platform's preferred story and start optimizing for actual business results. Your media buyers are accountable to a number the platform cannot influence.
That is the entire difference between a brand that scales and one that spins.
If you want to build a measurement system that separates platform noise from actual profitability, our analytics team can help.